Preparing a report
How about making a presentation right here?
Download original notebookMarkdown language together with WLX (optional) to make slides. The core technology is RevealJS, but you don't have to know it to use it
Text, heading, sections
Type in a new cell .slide (first line) and then
.slide

# Slide 1

Some text, other text...

---

# Slide 2

May be even <span style="color:red">equations</span>

$$
\\hat{H} \\Psi = E \\Psi
$$
<dummy >
# Slide 1

Some text, other text...

---

# Slide 2

May be even <span style="color:red">equations</span>

$$
\\hat{H} \\Psi = E \\Psi
$$</dummy>
Note: use arrows to navigate, Q to place a pointer
Note: keep it simple. One cell - one slide
Cells with slides can be merged to a complete presentation using .slides cell type
To go fullscrenn press f on a slide
Projector feature
To project slides to a new window (like a normal presentation tool) navigate to a cell's menu
and click Project to a window. It will evaluate an input cell and show the result in a new window.
Embed pictures
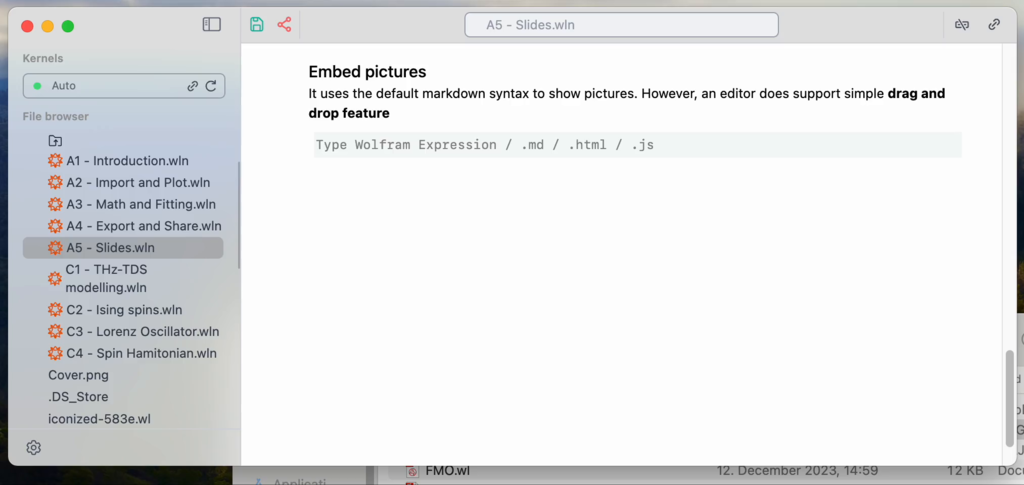
It uses the default markdown syntax to show pictures. However, an editor does support simple drag and drop feature

.slide This is an example 
<dummy > This is an example </dummy>
.md
## Animation
A fragments of a text can be maked using special tag in order to reveal it or highlight (see more [here](https://revealjs.com/fragments/))
Animation
A fragments of a text can be maked using special tag in order to reveal it or highlight (see more here)
.slide

# Slide Title

This will be revealed <!-- .element: class="fragment" data-fragment-index="1" -->

This will be gone <!-- .element: class="fragment fade-out" data-fragment-index="2" -->

This will be highlighted <!-- .element: class="fragment highlight-red" data-fragment-index="3" -->
<dummy >
# Slide Title

This will be revealed <!-- .element: class="fragment" data-fragment-index="1" -->

This will be gone <!-- .element: class="fragment fade-out" data-fragment-index="2" -->

This will be highlighted <!-- .element: class="fragment highlight-red" data-fragment-index="3" --></dummy>
Embedding Wolfram Language
The most use case is our figures
Figure = Plot[Sin[x], {x,0,2Pi}, ImageSize->500];
Now lets embed it to our slide
.slide

# Figure

<Figure/>
<dummy >
# Figure

FrontEndExecutable[d69b3dbb-33aa-4074-9049-476acf09727f]</dummy>
It works it a way, if it was a special XML/HTML tag. Any other wolfram expressions are also valid
GetDate := TextString[Now]
.slide

Today is <GetDate/>
This is more advanced topic and will be covered in other tutorials
Merging slides
into a complete presentation
Create a new cell with .slides extension.
.slides

Thank you for your attention
Once evaluated, it merges all slides from all cells found in the notebook into a single presentation.
Scientific report
Assumming you have gone thorugh the previous tutorials, now we can take our fitted data and presented it here
Before we iconized the plot into the following symbol
Figure = (*VB[*)(Get[FileNameJoin[{".iconized", "iconized-5fec.wl"}]])(*,*)(*"1:eJxTTMoPSmNkYGAoZgESHvk5KRAeH5DwTM7Py6xKdcvMSXXKr8g8cJyRAQDvgAv9"*)(*]VB*);
Figure
(*VB[*)(FrontEndRef["a06f8a7f-7541-402f-bf0f-a5142d30845f"])(*,*)(*"1:eJxTTMoPSmNkYGAoZgESHvk5KRCeEJBwK8rPK3HNS3GtSE0uLUlMykkNVgEKJxqYpVkkmqfpmpuaGOqaGBil6SalGaTpJpoamhilGBtYmJimAQCDPxVs"*)(*]VB*)
Note: please use variables starting from a Captial letter to store data to be embedded to your slide layout
Now create a simple slide
.slide

# Reflectivity in $Fe_2 Mo_3 O_8$
Prepared by Friedrich Vormelker

---

# Fitted with a single Lorentz oscillator

<Figure/>
<dummy >
# Reflectivity in $Fe_2 Mo_3 O_8$
Prepared by Friedrich Vormelker

---

# Fitted with a single Lorentz oscillator

FrontEndExecutable[2c27eca2-5882-48e3-81c6-56a21a596d91]</dummy>
Note: try to zoom in and pan the plot